D3S actively monitors key components of our production infrastructure. To do this, we use a combination of cutting-edge tools, including Loki, Grafana, Prometheus, AlertMonitoring, and UptimeRobot.
Loki collects and labels logs from our applications. Prometheus meanwhile collects data that are published by blackbox_exporter (services reachability and self tests), db_checker (database integrity checks) and metrics from Kubernetes.
Prometheus also contains alerting rules. All alerts are caught by AlertManager, which provides pager services through Slack. We use Slack to coordinate our monitoring activities.
We use Grafana to view and analyse all data collected by Prometheus and Loki. To achieve better reliability of our monitoring, we use UptimeRobot (a 3rd-party tool that runs outside of our infrastructure), to mirror reachability tests from blackbox_exporter.
What We Monitor
- Services Reachability
- We conduct tests via HTTP GET (blackbox_exporter). We collect test results from two instances of blackbox_exporter, both of which run in docker on Synology servers. These Synology servers are located outside of D3S’s infrastructure.
- We use HTTP GET to run two types of tests:
- A basic test checks to see if the landing page of an application or service is reachable and returning a 2xx response.
- Additional testing is performed using a self-test, which is triggered by RestAPI.
- Database Integrity
- We use db_checker, an internally developed tool, to check database integrity. It is a C# application running in docker that runs SQL queries against tested databases. Tests are specified in XML with use of CRON-like syntax.
- Tests are divided into general (synchronization, jobs, …) and client specific queries to ensure a high level of quality assurance.
- Kubernetes Metrics
- Prometheus Operator runs on Kubernetes and collects all runtime metrics from it. Grafana runs on Synology in our data center and is connected to it. We observe Kubernetes nodes, pods, network, RabbitMQ, and more.
- Prometheus Operator runs on Kubernetes and collects all runtime metrics from it. Grafana runs on Synology in our data center and is connected to it. We observe Kubernetes nodes, pods, network, RabbitMQ, and more.
- Dead Man Switch
- All blackbox_exporters periodically call the API in StatusCake. If StatusCake does not receive an “I am alive” signal every five minutes it starts issuing alerts. We do this to make sure that the entire Prometheus stack is working and that Slack is receiving correct data.
- All blackbox_exporters periodically call the API in StatusCake. If StatusCake does not receive an “I am alive” signal every five minutes it starts issuing alerts. We do this to make sure that the entire Prometheus stack is working and that Slack is receiving correct data.
Technologies
Logs Collection
We use Loki, a log aggregation system, to collect logs. Loki does not index data but rather identifies each log stream by set of labels. This results in a relatively low demand on system resources. Even though searching though it is not as fast as an indexed system, its low demand allows it to run continuously.
Metrics Collection
Prometheus
Prometheus periodically collects data from configured metrics that are published by application components. We implement alerts using Prometheus’s query language.
AlertManager
AlertManager handles alerts sent by Prometheus. We use AlertManager to deduplicate and group errors so that our response team responds only to relevant errors. We also use AlertManager to specify silences in the event of planned/controlled outages to prevent the IT Security Team from receiving irrelevant messages. Alerts in a “firing” status are sent to Slack, where our service teams receive notifications.
Data Viewing
We use Grafana for querying, visualizing and alerting over data metrics. Grafan allows us to create custom dashboards for faster and easier analysis of ingested data.
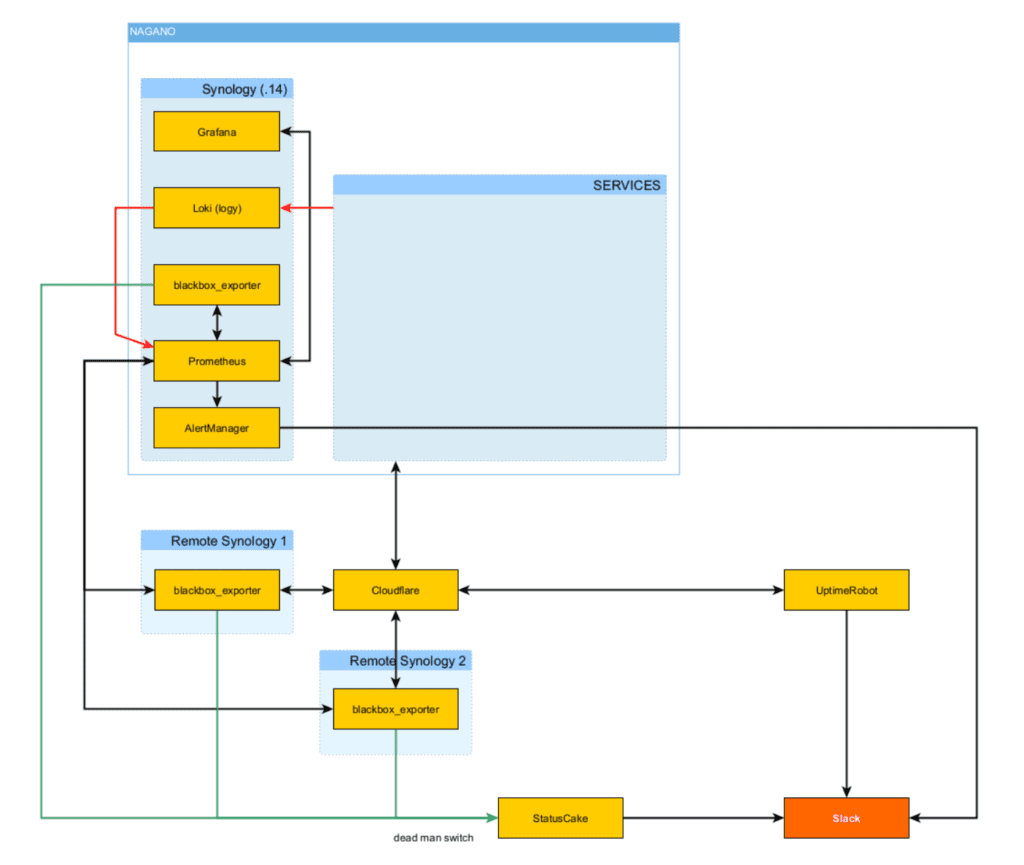
Monitoring Architecture
The Prometheus stack mainly runs on a Synology server in Docker, where Loki, Prometheus, Grafana, AlertManager, and other data monitoring tools are located. Blackbox_exporters are located on Synology devices outside of our data center network, though we keep one instance of blackbox_exporter on Synology in our data center as a “dead man switch”. Each application we monitor has a plugin that sends data to Loki for labeling and storage.
Prometheus reads data from Prometheus metrics servers, which are connected to production environment applications. Prometheus also periodically runs alerts (queries in Promql language) and if it detects an error, it sends it to AlertManager. AlertManager than deduplicates and groups these errors and sends relevant ones to Slack, which we use as our pager system.
Best Practices
We apply the following best practices to alerting and dashboard configuration:
Alerting
- Alerts should be as short as possible while containing important information
- Alerts that are fired too often should be revised
- Fire alerts after a reasonable downtime (10 minutes for front end services is reasonable)
- Alerts should be divided into groups of interest (developers and DevOps subscribe to relevant groups)
Dashboards
- Do not use the ROWS component of dashboards
- There should not be more than 6 graphs or tables on one dashboard
- Use drill down (Main dashboard → Component overview → Detail)